TABLE OF CONTENTS
Describing and classifying state fragility
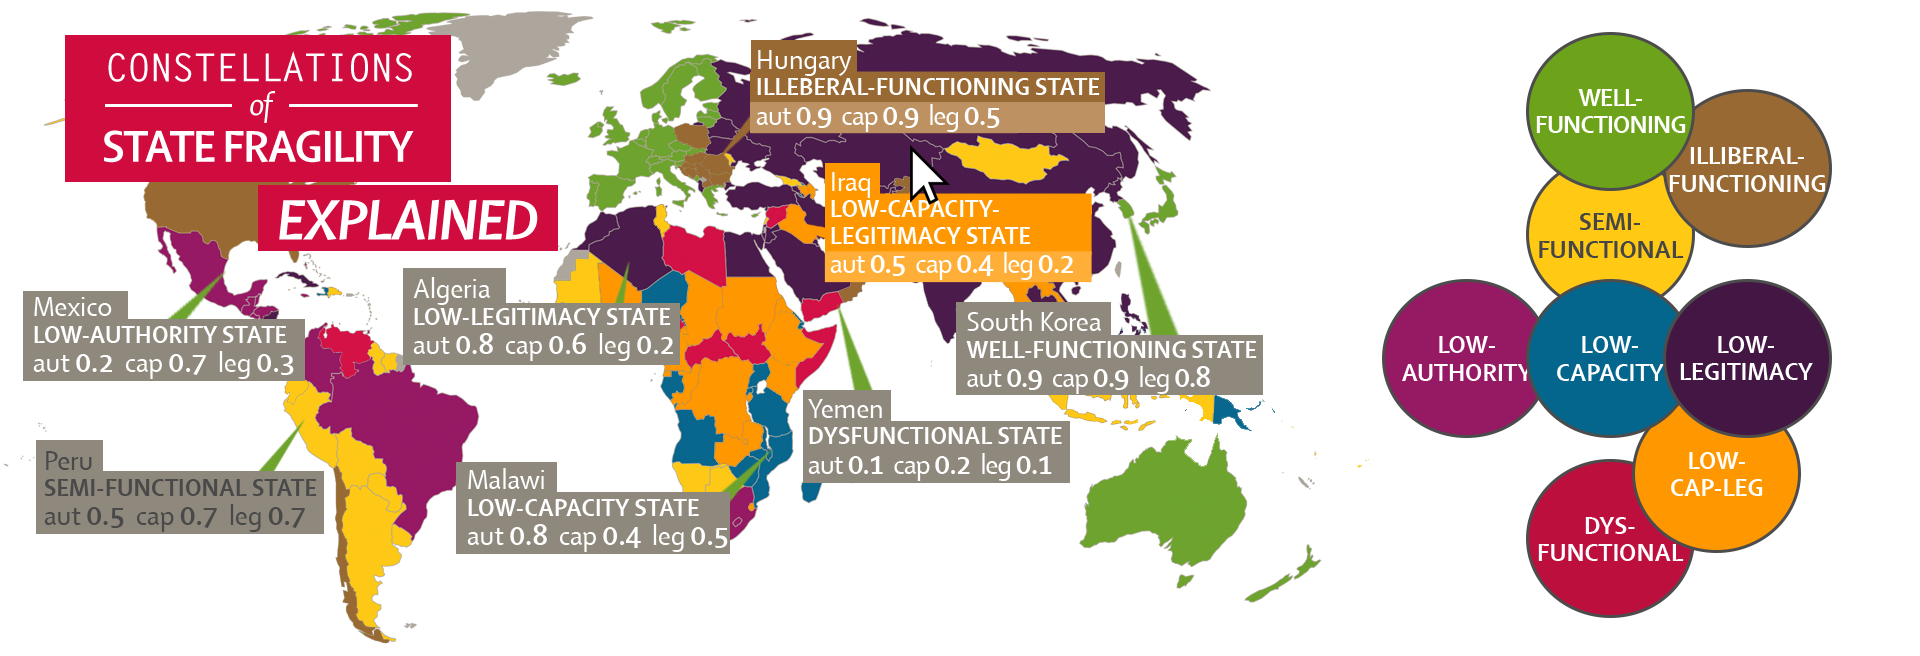
Constellations of State Fragility provides an empirical typology of states from a fragility perspective. It uses global data from 2005-2020 to identify typical constellations of state fragility. State fragility is defined as deficiencies in one or more of three core functions of the state. These functions include state authority, state capacity and state legitimacy. Authority refers to the state’s ability to control violence. Capacity refers to the state’s ability to provide basic public services. Legitimacy refers to the state’s ability to obtain the population’s consent to the state’s claim to rule.
How can you use our tool?
Examine the global distribution of state fragility, and individual country time trends
Constellations of State Fragility identifies recurring patterns of state fragility and allows you to determine which fragility constellations describe which countries best. You can observe the global distribution of fragility constellations over time and compare the relative performance of individual states on different dimensions of state fragility against other countries or across time. Our data is available free of charge. Please feel free to download, use and cite any graph, key statistics or even the entire data spreadsheet.
The following view options provide you with an excellent overview of our data
- Compare the global distribution of fragility constellations on our world map
- Select or deactivate individual constellations to focus your attention on specific fragility constellations of interest
- Use the time slider to view how the data varies over time
- To assess the statistical uncertainty of our classification, click on the probability check buttons in the legend
- By changing to the dimension scores tab, you can view the global distribution of scores on the individual dimensions authority, capacity and legitimacy
- To compare individual countries, simply click on the countries in the map or use the search function in the compare tool
- By clicking on “Details” in the compare window, you can view how the scores of a country varied over time. For example, you may check how the dimension scores or individual indicators evolved. As in the global view, the probability tab gives you an overview of the countries probable fragility constellations in different years.
- To zoom in on a specific country, use our “find a country” search option.
What makes Constellations of State Fragility exceptional?
Constellations of State Fragility is a unique tool which uses advanced statistical methodology to identify typical constellations of state fragility in the world. Our methodology allows us to distinguish core problems underlying state fragility where additive indices produce identical values. Furthermore, we are able to describe how certain we are about any classification. Simply use the probability view mode of the world map or individual country pages to assess how likely a state is a member of, e.g., the low-capacity constellation.
The 8 Constellations of Fragility
DYSFUNCTIONAL STATES
States in this cluster have very low scores on all dimensions of statehood. These states usually have very limited authority over the use of physical violence, have little capacity to provide basic public services and score low on legitimacy.
LOW-CAP-LEG STATES
States in this (low-capacity-and-legitimacy) cluster have some authority over the use of physical violence, but very limited capacity to provide basic public services and low scores in legitimacy.
LOW-AUTHORITY STATES
States in this cluster have very limited authority over the use of physical violence, but have the capacity to provide some basic public services and have medium scores on legitimacy.
LOW-CAPACITY STATES
States in this cluster display little capacity to provide basic public services, but they have decent authority over the use of physical violence and usually have mediocre scores on legitimacy.
LOW-LEGITIMACY STATES
States in this cluster have low to mediocre scores of legitimacy, but usually have decent authority over the use of physical violence and the capacity to provide some basic public services.
SEMI-FUNCTIONAL STATES
States in this cluster have medium scores on all dimensions of statehood. These states usually have decent authority over the use of physical violence, possess the capacity to provide some basic public services and score better than average on legitimacy.
ILLIBERAL-FUNCTIONING STATES
States in this cluster have very good scores in authority over the use of physical violence and in the capacity to provide basic services, but they lag behind in legitimacy scores.
WELL-FUNCTIONING STATES
States in this cluster display very good scores on all dimensions of statehood. These states usually have the authority over the use of physical violence, possess the capacity to comprehensively provide basic public services and score high on legitimacy.
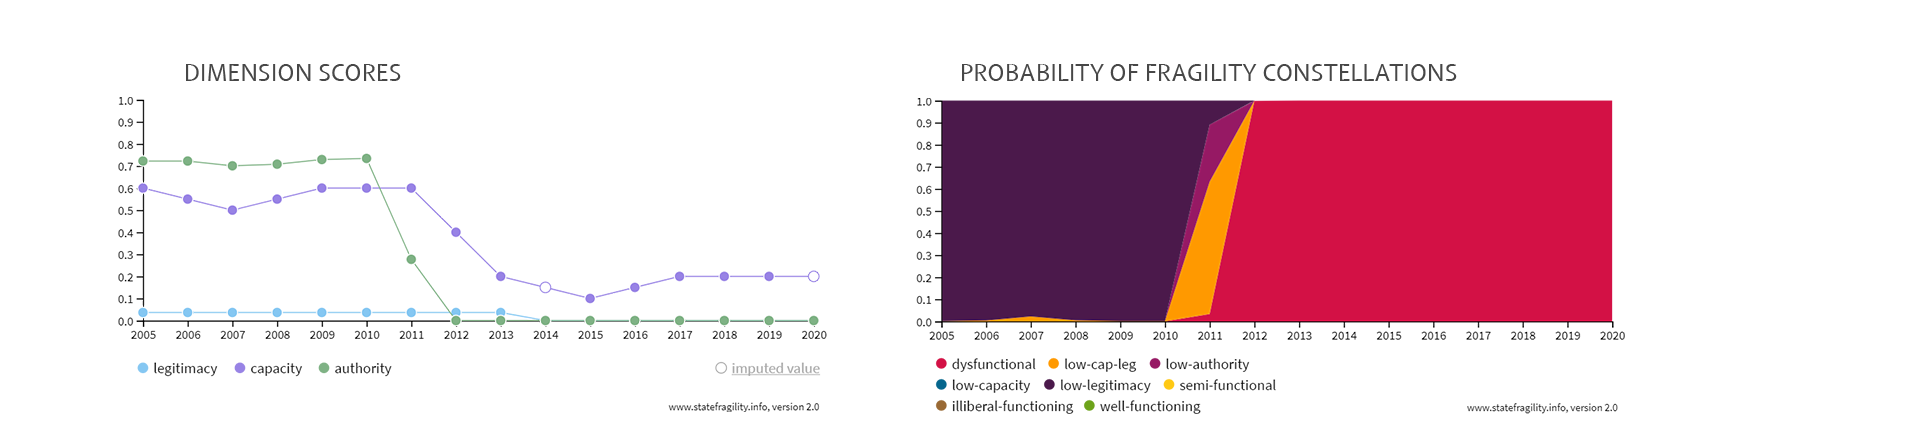
Example: The case of Syria
Constellations of State Fragility reliably picks up changes occurring in specific countries over the years. Our indicators highlight, for instance, how Syria changed from a low-legitimacy state until 2010 through a borderline case between low-cap-leg and low-authority in 2011 to a dysfunctional state since 2012.
Theoretical background
State fragility: the debate
The weakness, fragility or failure of states has evolved into one of the major narratives of politics and international relations in the post-Cold War era. While initially a widely-used term labelled certain states as “failed states”, in recent years the less offensive terminology of “state fragility” has become more common. Since the late 2000s, the concept of state fragility received high visibility in development policy documents, such as the European Report on Development 2009, a 2011 policy guidance paper by the OECD Development Assistance Committee, and the World Development Report 2011. This prominent use of the concept in the policy community led to demands for orientation in dealing with fragile states. As a consequence, a rising number of fragility indices emerged that tried to provide some of this orientation. Examples include the Fragile States Index (formerly Failed States Index), the Index of State Weakness, the State Fragility Index, the Political Instability Index, the Country Indicators for Foreign Policy and many others.
In contrast to these existing tools, Constellations of State Fragility was conceived to correct a central weakness that all existing fragility indices share: they simplify the complicated reality behind the stability or decay of statehood to such an extent that they are of very limited use for the operational task of crafting policies to counter state fragility. The main issue with these indices is not so much the ever-difficult challenge of measurement but rather their common conceptual assumption that such a multidimensional concept as statehood can be aggregated and projected onto a one-dimensional scale, thereby allowing different dimensions to compensate for each other, without a substantial distortion of information. Constellations of State Fragility, by contrast, classifies states while maintaining the multidimensionality of the state fragility concept. It identifies substantively different constellations of fragility in states that would otherwise receive very similar scores on aggregate indices.
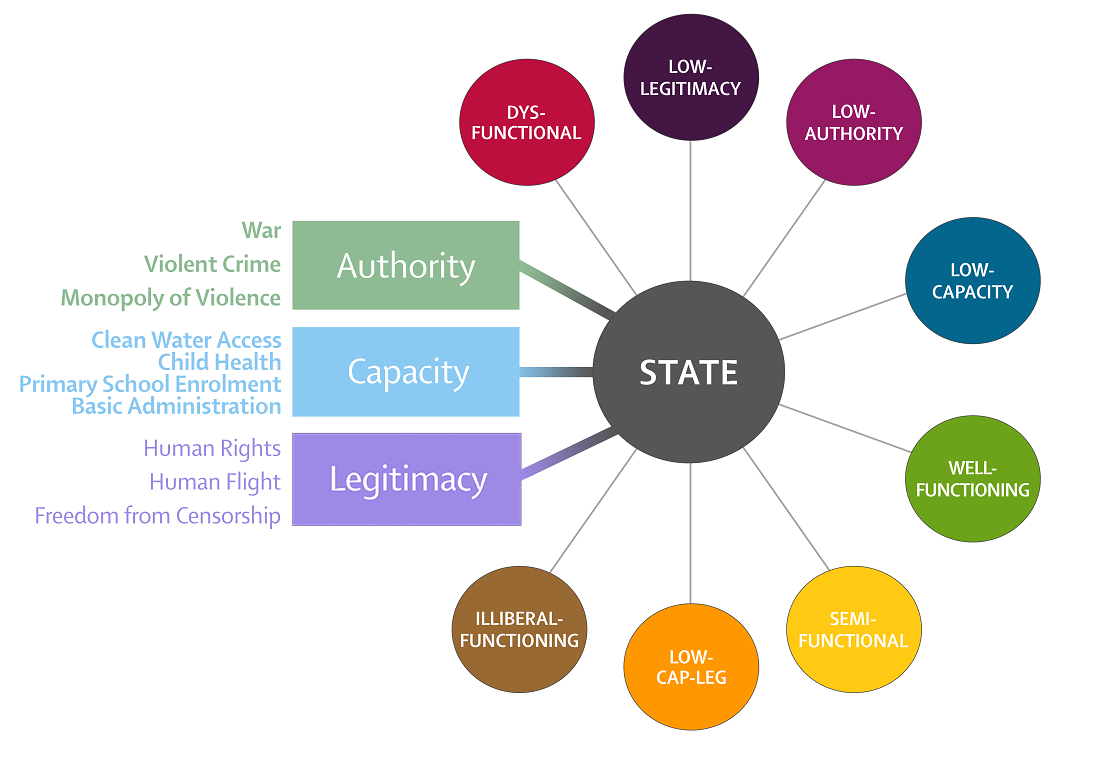
Fragility dimensions
States can be fragile due to many different deficiencies. Accordingly, most scientific analyses of state fragility since the early 2000s have disaggregated this phenomenon into several dimensions. Based on this literature, we conceptualise fragility as constituted of deficiencies in three distinct, though interdependent, dimensions: state authority, state capacity and state legitimacy. Each dimension represents a particular type of state-society relations and can be traced back to complementary strands of political theory (see Grävingholt, Ziaja & Kreibaum (2015), Ziaja, Grävingholt & Kreibaum (2019).
Authority
The authority dimension measures the ability of the state to control the use of physical violence within its territory. Authority is measured using battle-related deaths, homicide rates as well as a composite indicator of a state’s monopoly of violence.
Capacity
The capacity dimension measures the ability of the state to provide basic public services to its population. Capacity is measured using child mortality rates, access to clean water, primary school enrolment rates as well as a composite indicator of basic administration capacity.
Legitimacy
The legitimacy dimension denotes the ability of the state to obtain the consent of the population to the state’s dominance. Legitimacy is measured using indicators of government censorship, human rights scores as well as the number of asylums granted to citizens of a state.
Methodology
Our methodology explained
We use three to four indicators to measure each dimension for 173 countries over the period 2005–2020. Each indicator is standardised to values between 0 and 1. A value close to 1 indicates a good performance. A value close to 0 indicates that a state performs badly in this domain. We combine the transformed scores of our indicators with a ‘weakest link approach’: The score of each dimension is determined by the lowest value among all of its indicators. This approach is equivalent to considering each variable a necessary component of a functioning state in the respective dimension. Based on these dimension scores, we employ the statistical approach of finite mixture modelling to identify clusters in the data. We find that a solution with eight clusters describes the data best.
In version 1.0, based on data for 2005-2015, the model identified six clusters as the most appropriate fit. With roughly 25 percent more observations, version 2.0 allows a more nuanced picture.
10 indicators
Battle-related deaths per 100,000 inhabitants.
This includes all casualties directly related to combat occurring within the territory of a country. The measure reflects the intensity of internal and external attacks on the integrity of a state and thus the degree to which the state faces organized (but only acute) challenges to its monopoly of violence.
Source: Gleditsch et al. (2002), Themnér and Wallensteen (2011)
Homicides per 100,000 inhabitants
Homicide is defined as ‘unlawful death purposefully inflicted on a person by another person’ (UNODC 2013: 9). While individual instances of homicide do – in the vast majority of cases – not stem from explicit challenges to the dominance of the state, widespread lethal crime can be considered an indicator of organized crime in conflict with governing authorities.
Source: UNODC (2019)
Monopoly of violence indicator of Bertelsmann Transformation Index
The indicator is taken from the Bertelsmann Transformation Index. It provides a direct expert assessment which detects latent conflict.
Source: BTI (2022)
Basic administration Bertelsmann Transformation Index
The indicator is taken from the Bertelsmann Transformation Index. It provides a direct expert assessment on the existence of fundamental structures of a civilian administration, such as a basic system of courts and tax authorities.
Source: BTI (2022)
Child mortality
The indicator measures under-five mortality per 1,000 births. It is a proxy for general medical infrastructure and disease control.
Source: Vollset et al. (2020)
Education
The indicator is measured by the rate of primary school enrolment. It gives an indication of ability of state to provide basic education.
Source: UIS (2020)
Asylums granted
The indicator is measured by the number of asylums granted in other countries per 100,000 inhabitants of the country of origin. It provides a good indicator for politically (rather than economically) motivated exit.
Source: UNHCR (2021)
Government censorship
The indicator measures whether the governament attempts to directly or indirectly censor the print or broadcast media.
Source: Coppedge et al. (2021), Mechkova et al. (2019), Pemstein et al. (2021)
Fariss’ index of human rights protection
The indicator measures the latent level of human rights protection based on empirically observed data.
Source: Fariss et al. (2020)
Access to clean water
The indicator measures the share of the population with access to improved drinking water sources. It is a proxy for general hygiene standards and disease control.
Source: WHO and UNICEF (2021)
Data coding, transformation and imputation
Assembling reliable and comparable cross-national data is a challenge. In order to combine the information across the variables into dimension scores, we transform all raw indicators to scores ranging from 0 to 1, where higher values imply better outcomes. This is done by first truncating the raw variable scores at pre-defined lower and upper bounds. This step is necessary to avoid that extremely large values dwarf the differences between other countries in this dimension. We calibrated these extremes so that variables that best represent each dimension determine the lion’s share of each dimension’s scores. For some years and some countries, data is unavailable. We use interpolation and extrapolation to fill in missing values. Values which have been filled in or, statistically speaking, imputed, are always labelled as imputed in all numerical representations of our data. Please interpret imputed values with caution.
PUBLICATIONS
How to cite
To cite Constellations of State Fragility, please follow the guidelines under Download Data.
Jörn Grävingholt initiated and led the project, conceptualised the typology and contributed to the online visualisation. Sebastian Ziaja co-led the project, conceptualised the typology, developed and conducted the statistical estimations. Constantin Ruhe conceptualised the online visualisation, managed the website programming and supported data management. Patrick Fink supported the development of the online visualisation and managed the website programming. Merle Kreibaum provided data management and supported the conceptualisation of the typology. Christopher Wingens provided data management.
The Constellations of State Fragility model and web tool has been developed within the research programme “Transformations of political (dis-)order: Institutions, values & peace” at the German Institute of Development and Sustainability (IDOS).
Financing
Constellations of State Fragility has been developed with financial support of the
Disclaimer: Statements generated through and presented in the online tool Constellations of State Fragility do not necessarily reflect the official policy or position of the Federal Ministry for Economic Cooperation and Development or the German government.
Licensing

This work is licensed under a
Creative Commons Attribution 4.0 International (CC BY 4.0)
References
Bertelsmann Stiftung (2022). Transformation Index BTI 2016
Coppedge, Michael, John Gerring, Carl Henrik Knutsen, Staffan I. Lindberg, Jan Teorell, David Altman, Michael Bernhard, Agnes Cornell, M. Steven Fish, Lisa Gastaldi, Haakon Gjerløw, Adam Glynn, Allen Hicken, Anna Lührmann, Seraphine F. Maerz, Kyle L. Marquardt, Kelly McMann, Valeriya Mechkova, Pamela Paxton, Daniel Pemstein, Johannes von Römer, Brigitte Seim, Rachel Sigman, Svend-Erik Skaaning, Jeffrey Staton, Aksel Sundtröm, Eitan Tzelgov, Luca Uberti, Yi-ting Wang, Tore Wig, & Daniel Ziblatt (2021). “V-Dem Codebook v11” Varieties of Democracy (V-Dem) Project.
Fariss, Christopher J., Kenwick, Michael R., & Reuning, Kevin (2020). “Estimating one-sided-killings from a robust measurement model of human rights”. In: Journal of Peace Research 57 (6), 801–814.
Gleditsch, Nils Petter, Peter Wallensteen, Mikael Eriksson, Margareta Sollenberg, & Håvard Strand (2002). “Armed conflict 1946–2001: a new dataset”. In: Journal of Peace Research 39 (5), 615–637.
Grävingholt, Jörn, Sebastian Ziaja, & Merle Kreibaum (2015): “Disaggregating state fragility: a method to establish a multidimensional empirical typology”. In: Third World Quarterly 36 (7), 1281–1298. DOI: 10.1080/01436597.2015.1038340
Mechkova, Valeriya, Daniel Pemstein, Brigitte Seim, & Steven Wilson (2019). “Measuring Internet Politics: Introducing the Digital Society Project (DSP)” Digital Society Project Working Paper #1.
Pemstein, Daniel, Kyle L. Marquardt, Eitan Tzelgov, Yi-ting Wang, Juraj Medzihorsky, Joshua Krusell, Farhad Miri, & Johannes von Römer (2021). “The V-Dem Measurement Model: Latent Variable Analysis for Cross-National and Cross-Temporal Expert-Coded Data”. V-Dem Working Paper No. 21. 6th edition. University of Gothenburg: Varieties of Democracy Institute.
Themnér, Lotta & Peter Wallensteen (2011). “Armed conflict, 1946–2010”. In: Journal of Peace Research 48 (4), 525–536.
UIS – UNESCO Institute for Statistics (2020). School enrollment, primary (% net). UNESCO.
UNHCR – United Nations High Commissioner for Refugees (2021). Refugee population statistics database. UNHCR.
UNODC – United Nations Office on Drugs and Crime (2019). Global study on homicide 2019. UNODC.
Vollset, Stein Emil, Goren, Emily, Yuan, Chun-Wei, Cao, Jackie, Smith, Amanda E., et al. (2020). “Fertility, mortality, migration, and population scenarios for 195 countries and territories from 2017 to 2100: A forecasting analysis for the global burden of disease study”. In: The Lancet 396 (10258), 1285–1306.
WHO & UNICEF – World Health Organization & UNICEF (2021). WHO/UNICEF Joint Monitoring Programme (JMP) for Water Supply, Sanitation and Hygiene. World Health Organization and UNICEF.
Ziaja, Sebastian, Jörn Grävingholt, & Merle Kreibaum (2019): “Constellations of fragility: an empirical typology of states”. In: Studies in Comparative International Development 54 (2), 299–321. DOI: 10.1007/s12116-019-09284-3